

Amid the unprecedented market turmoil, Deutsche Bank's head of thematic research Jim Reid looks at some of the dislocations and extremes that the current Russia/Ukraine crisis has thrown up. In particular, Ried looks at commodities, rates and equities, as well as the dilemma that central banks find themselves in given high inflation and how loose policy is right now.
Let's start with energy dislocations
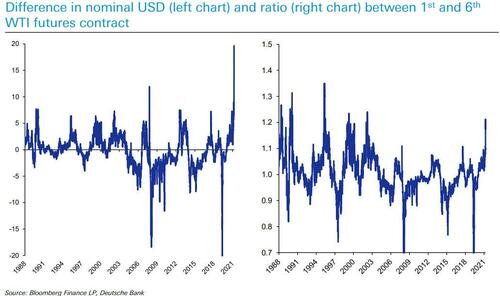
The amount of backwardation in WTI futures contracts (1st contract versus 6th contract, left chart) is at an all-time high in dollar terms, showing how dislocated oil prices are over the near term. When looking from a ratio basis (on the right), the 1st contract is 20% more expensive than the 6th and not quite as extreme but still the highest for 20 years.
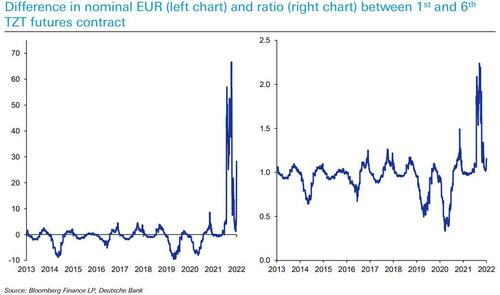
European natural gas prices have also shot higher, and backwardation has taken hold. However both the EUR and ratio difference between the 1st and 6th TZT contract are not as drastic as oil and not as dramatic as in December, suggesting the market now believes ultra high price pressures are here to stay.
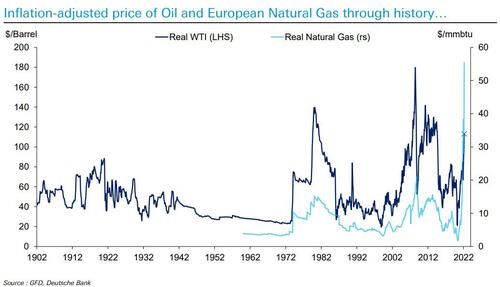
Gas prices are extraordinary relative to anything seen in the past whereas oil is only at the upper end of historical range in real terms.
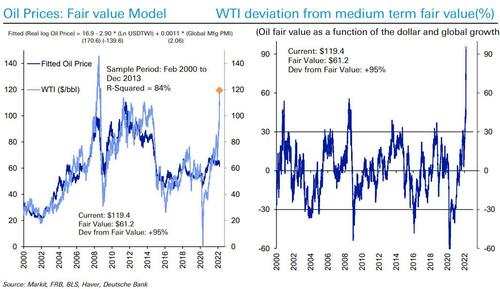
According to DB chief equity strategist, Binky Chadha, oil is way above fair value implied by dollar and global growth. Oil prices typically trade +/- 30% around fair value. The current premium is over 90%.
There have been some extraordinary commodity moves in recent days/weeks. Nickel trading was suspended after 250% intra-day move over 2-days on margin calls, short squeeze and supply concerns.

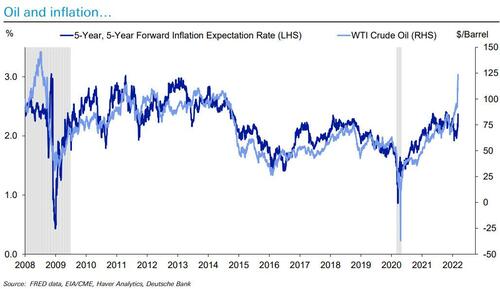
Oil has been a big driver of inflation expectations over the last decade… Will this latest commodity shock start to impact long-run inflation expectations.
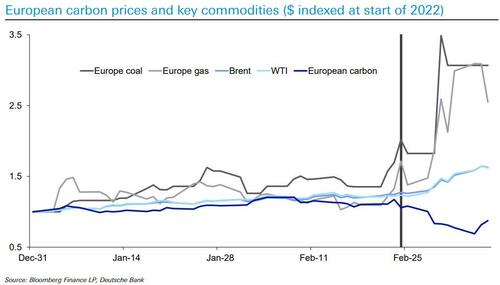
Despite fears that a restriction of gas supplies will lead to greater coal usage, carbon prices have dropped as large open-interest in put options at €60-€80 has evaporated, a potential signal of profit taking. It’s created a big dislocation to the rest of the commodity complex.
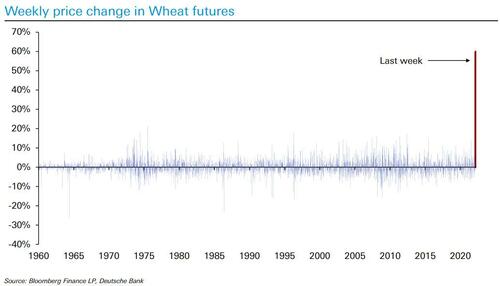
Wheat saw the largest weekly increase on record w/e March 4th. Over three times largest previous week in 60 years.
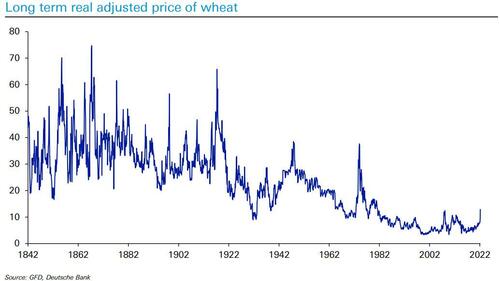
However wheat spike hardly shows up in long-term real adjusted price… over time production techniques become more and more efficient which has driven the price down for such a renewable commodity.
Next, we look at more marketwide VaR shocks:
The week ending March 4th saw largest move higher in commodity index on record.

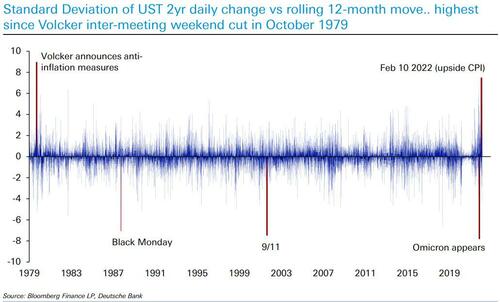
The US CPI number on Feb 10th saw a huge VAR shock at the front end of US treasury curve.
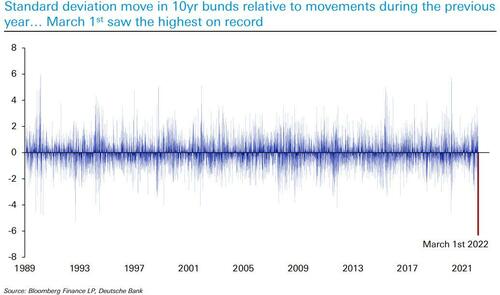
... However three weeks later 10yr Bunds saw a huge VAR shock in the opposite direction… volatility in rates is immense
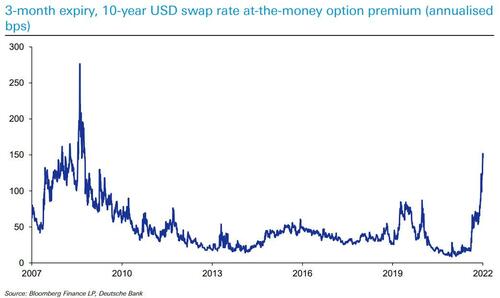
US rates volatility has increased to its highest levels since the GFC. This is seen in the cost of buying options that expire in the next 3-months on 10- year USD swap rates.
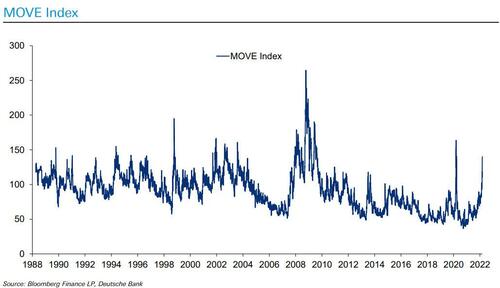
Similarly, the US MOVE Index (US implied vol of 1-month treasury options) is also at the highest since GFC outside of initial Covid shock.
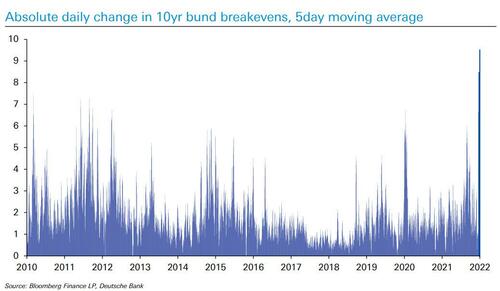
Ten-year bund breakevens have seen their biggest ever move and now at the highest since data started
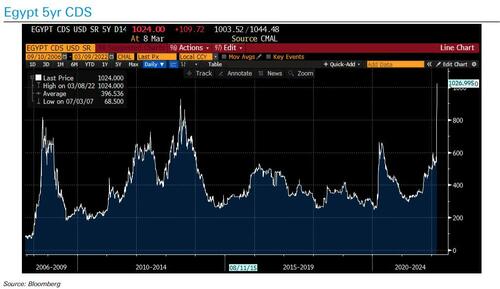
Egypt 5yr CDS has seen a huge spike to all time highs partly due to the commodity spike and worries about the impact on tourism
Focusing on the European financial sector, we find that some European assets trading at previous break up risk levels:
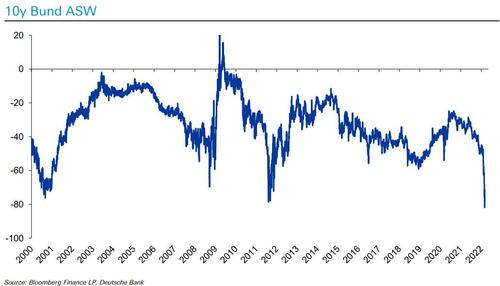
10yr Bund ASW traded at all time low on March 4th. Previous lows were either in deep recessions or at a time of Euro existential crises.
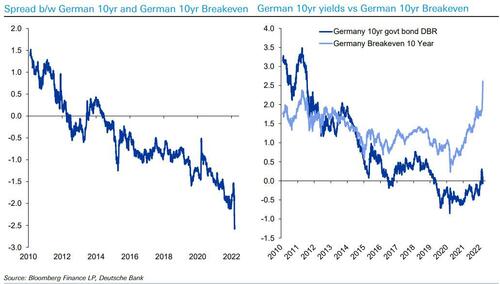
German 10yr Real yields using breakevens at extremes… breakevens at ATH while bunds have been back in negative territory in recent days.
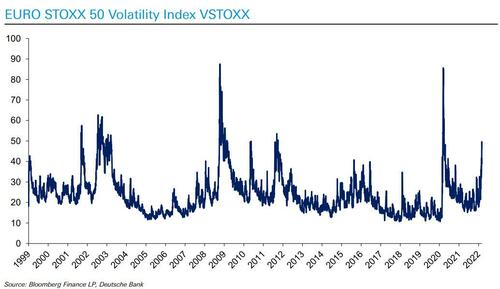
European equity volatility only higher in 00-02 dotcom bust, GFC, Greek default, EU Sovereign crisis and Covid
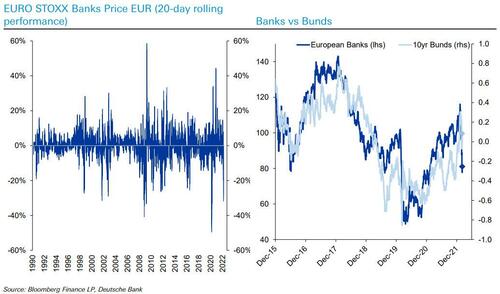
European banks seen one of the biggest 20-day declines on record… most of the move in line with bunds but in recent days the decoupling has grown as bund yields have climbed back up.
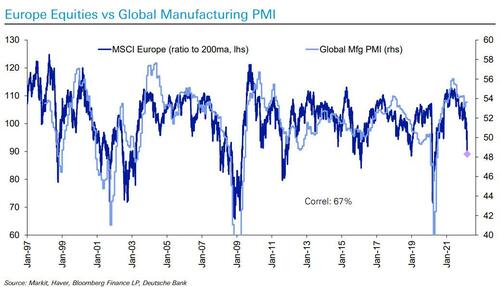
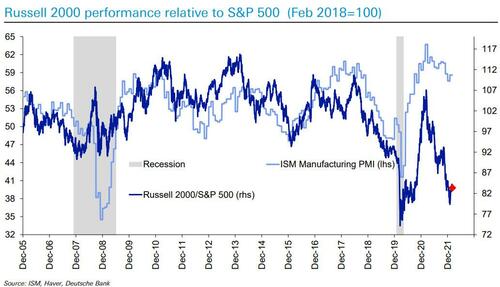
With all these dislocations, Reid asks "is the equity market telling us that a recession is imminent?" Let's see: the S&P 500 is pricing a big fall in ISM to mid-40s (i.e. recession) whether you use tech dominated index or the equal-weight one.
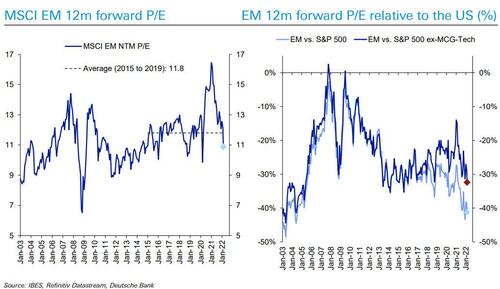
This takes us to some valuations observations: are EU,EM and US small cap equities very cheap vs S&P 500? According to Reid, European equities very cheap to US now… with or without mega-cap growth and tech
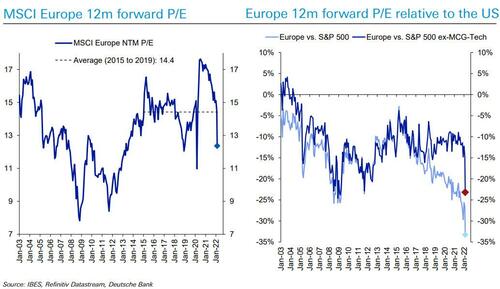
EM equities also very cheap to the US now
In US small caps are back close to the Covid extremes versus S&P 500
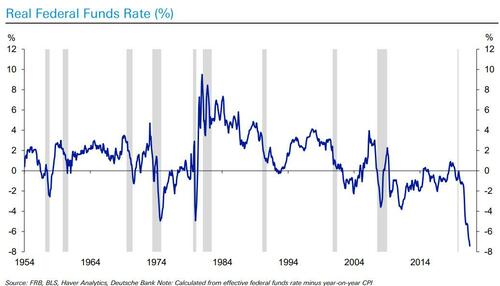
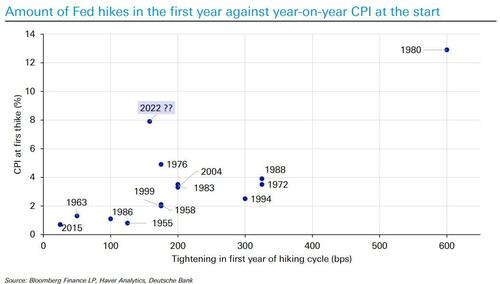
Which brings us to the central bank dilemma: Current Fed policy is the loosest ever outside of the WWII period… and policy looks extraordinarily extreme
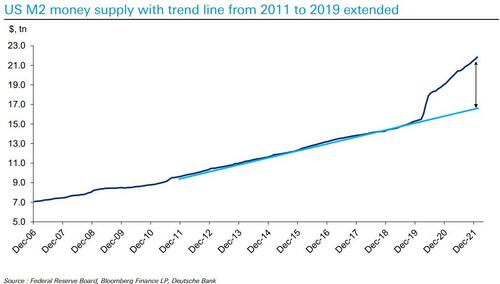
The Covid M2 spike has taken us well beyond pre-covid trend. Note again that GFC period saw no such spike…. Back then banks, consumers were aggressively de-levering and governments soon moved to austerity… very different this time with helicopter money and no delevering.
Are Fed policy moves still mispriced? The war might mean huge swings in expectations or risks of policy errors in both directions
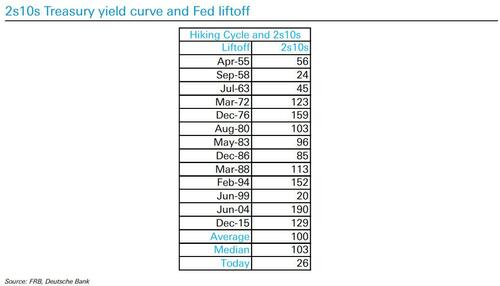
Unfortunately the Fed is about to start a tightening cycle with the 2s10s at close to the flattest its ever been at this point… doesn’t bode well for the duration of the cycle… however not embarking on a hiking cycle could be worse longer term in terms of embedding inflation in the economy…
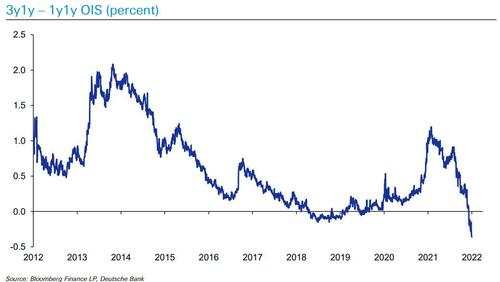
3y1y – 1y1y OIS rates are at their lowest in a decade. That is, markets are pricing the Fed funds rate to be 36bps higher from 2023-2024 than 2025- 2026. Markets are expecting the Fed to have to quickly cut rates shortly after the hiking cycle begins, which looks like a hard landing.
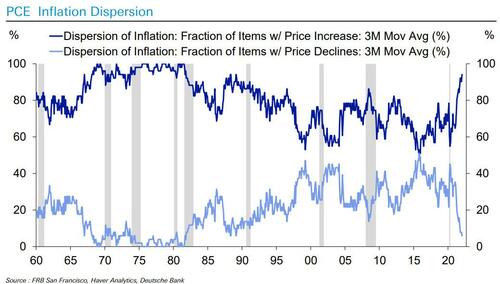
US inflation is already broad based
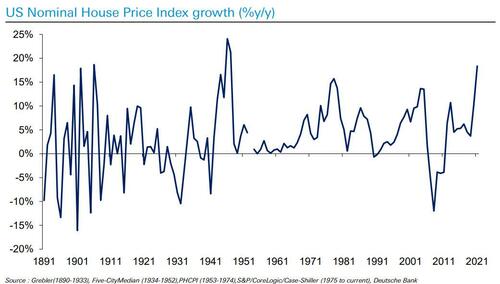
The Fed also has to deal with the highest house price growth on record outside of two post WWII years
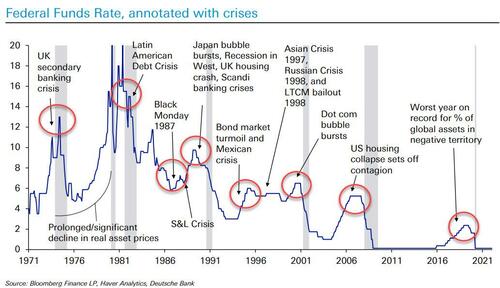
Which brings us to what may be our favorite chart: as DB's Jim Reid notes, every Fed hiking cycle in the fiat high debt era has led to some kind of financial crisis somewhere across the world
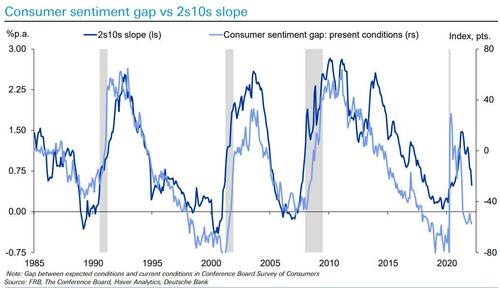
Confirming that the Fed is hiking to purposefully spark a recession - if not depression - in order to destroy enough commodities demand, consumer sentiment gap between present and expected conditions at extremes and suggesting a recession is imminent…
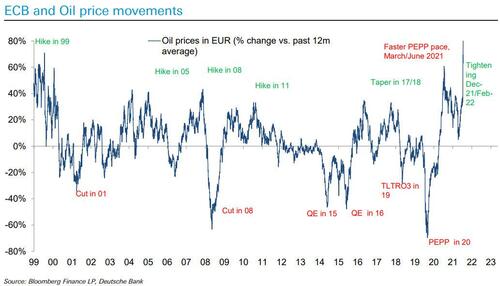
The ECB has almost always been pro-cyclical in terms of energy prices… can they justify easing on lower energy prices in 2014 and not tightening due to higher energy in 2022.
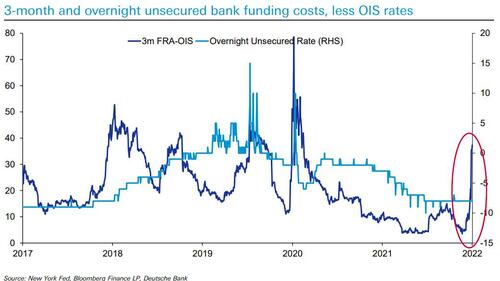
Finally, DB notes that typically flights to liquidity force issuers to pay higher rates for unsecured funding, at both term and overnight tenors. But this time, the cost of 3m funding has spiked while overnight funding rates have been flat, suggesting there are dislocations in filtering the glut of USD in the system to borrowers.
via zerohedge


")